
What we measure, and why
Anomalous samples roughly a dozen live dimensions per process every tick — CPU, real memory, energy with a P/E-core split, disk I/O, wakeups, GPU, network, Neural Engine, temperature and power — at a fraction of a percent of CPU.
One tick, every dimension
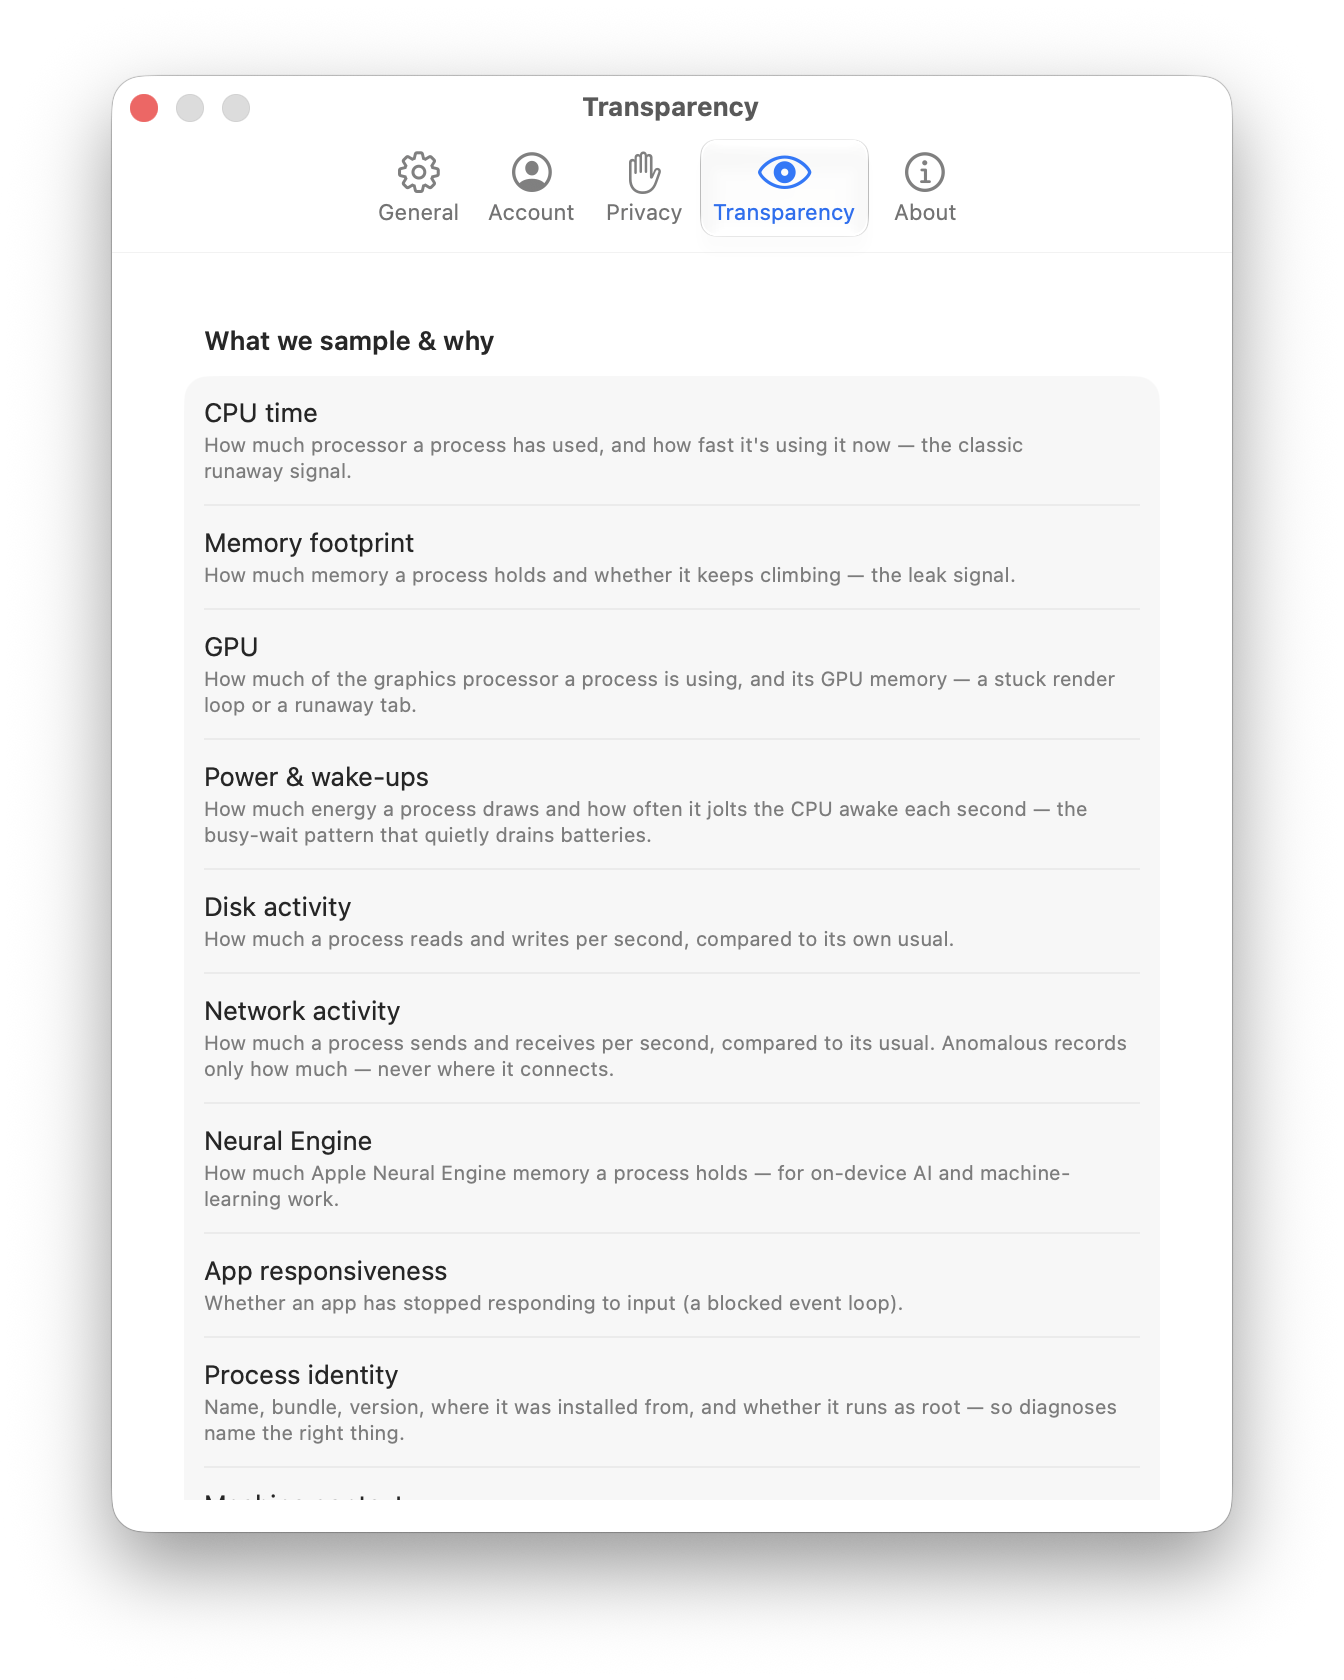
About every 60–90 seconds (a little more often on wall power, gentler on battery), Anomalous takes a snapshot of every running program on your Mac. For each one it records the same fixed set of numbers: how much processor, memory, disk, energy, battery-costing wakeups, graphics chip, AI accelerator, and network that program is using. Each number is one dimension of behavior. Together they are the signals Anomalous watches so it can notice when a program that was behaving quietly starts misbehaving.
One snapshot of one program at one instant is a ProcessSample: about eleven measured dimensions plus the program's identity, a timestamp, and its own uptime. You never see these numbers scrolling by. They run silently in the background and only surface as evidence when a program crosses a threshold and gets flagged. That is why every diagnosis can say something concrete like "using far more memory than it normally does."
Anomalous never judges a raw number. Every counter is cumulative since the program started, so the detection rules measure the rate of change over a window and compare it to that program's own learned baseline. A value of 0 always means "unknown," never "reset to zero."
Under the hood
Most of a tick's data comes from a single macOS system call, proc_pid_rusage, requested at the richest flavor RUSAGE_INFO_V6. That one call returns CPU time, resident and physical memory, disk bytes, energy, wakeups, instructions, cycles, and the Neural Engine footprint together. If the kernel rejects V6 it retries at the older V4 layout into the same zeroed buffer, so V6-only fields simply read 0 = unknown instead of failing. See Collector.swift:130-160 and ProcessSample.swift:5-48.
Compute: CPU, cycles, energy, P/E split
CPU time is the processor seconds a program has burned since it started. A program pinned high for a sustained window is the classic sign of a wedged loop or runaway task. Anomalous reads both a lifetime ratio and an instantaneous rate, so a once-hot, now-idle program can heal instead of being blamed forever.
Energy is the direct battery-drain measure, reported in nanojoules across all cores. It is the honest analog of Activity Monitor's "Energy Impact." Anomalous also tracks the P/E split — how much of that energy landed on the expensive performance cores versus the efficient ones. Instructions and cycles give real work-per-cycle (IPC): the ratio tells a program doing productive busy-work apart from one just spinning idle and burning cycles.
Under the hood
CPU time is ri_user_time + ri_system_time converted with the mach timebase (Collector.swift:144). Energy is ri_energy_nj with the performance-core share in ri_penergy_nj; both are V6-only and read 0 on the V4 fallback (Collector.swift:101-105,151-152). Instructions and cycles are ri_instructions and ri_cycles (Collector.swift:110-113). The per-process uptime comes from ri_proc_start_abstime — always this process, never system uptime — and is the denominator for the CPU ratio and the warm-up gate (DetectionRules.swift:189-192).
Memory: real footprint vs RSS
Anomalous measures memory two ways and trusts the honest one. The primary number is physical footprint (phys_footprint) — the same value Activity Monitor shows in its "Memory" column, and the number the kernel actually kills a process on. Monotonic growth in footprint above a floor is a memory leak.
The older number, resident set size (RSS), is kept only as a secondary signal. A program's own memory-mapped executable can inflate RSS; in early testing RSS ran roughly 3x overstated. Building the leak rule on footprint instead of RSS means far fewer false alarms.
Under the hood
phys_footprint reads from ri_phys_footprint and tracks a lifetime high-water mark; it falls back to RSS only when it reads 0. RSS is ri_resident_size. See ProcessSample.swift:10-20, Collector.swift:145-148, and the footprint-first leak rule at DetectionRules.swift:148-150,263-267.
I/O and wakeups
Disk I/O is the cumulative bytes a program has read and written. Sustained throughput far above its own baseline is disk thrash. The floor is set deliberately high — around 40 MB/s over ten minutes, roughly 24 GB — so only real, sustained abuse flags.
Wakeups are the quiet battery killer. A program can sit at modest CPU while waking the processor thousands of times a second by busy-polling. A 1 ms busy-poll measured about 1,400 wakeups per second, versus a healthy daemon well under 10 per second. Anomalous counts both idle and interrupt wakeups, and requires some real CPU alongside them so that an idle text editor is never falsely blamed.
Under the hood
Disk is ri_diskio_bytesread and ri_diskio_byteswritten (Collector.swift:149-150, rule at DetectionRules.swift:142-147). Wakeups are ri_pkg_idle_wkups and ri_interrupt_wkups (Collector.swift:106-109), with the CPU-corroboration guard at DetectionRules.swift:126-141.
GPU, Neural Engine, network
Three richer dimensions live outside the rusage syscall.
GPU time per process is how much of the graphics chip a program is using. Apple's GPU driver publishes one node per GPU-using process in the IOKit registry, each carrying an accumulatedGPUTime counter tagged with the owning process. Sustained use around 40% or more of the device for ten minutes is a real workload worth flagging; a compositor blip stays humanly silent.
Neural Engine (ANE) memory shows which program is holding on-device AI models in the Apple Neural Engine. It arrives free in the V6 tail of the same rusage call already issued — no extra private API.
Network bytes per process come from the same source that nettop and Activity Monitor use. Sustained throughput far above baseline — the floor is about 25 MB/s, roughly 15 GB over ten minutes — catches exfiltration or a runaway uploader, while the seasonal baseline keeps your nightly cloud backup quiet. Only byte counts are recorded; the remote endpoint is never stored.
Under the hood
GPU time sums accumulatedGPUTime across a pid's AGXDeviceUserClient registry nodes, keyed by the pid parsed from IOUserClientCreator (GPUSampler.swift:69-129). ANE memory is ri_neural_footprint and ri_lifetime_max_neural_footprint, V6-only, 0 on V4 fallback (ProcessSample.swift:40-44, Collector.swift:114-118). Network bytes fold per-socket flow deltas from the private NetworkStatistics framework into a monotonic per-pid accumulator (NetworkStatsSampler.swift:170-188); destinations are noted in code as "a future dimension" and left unused.
Temperature and power
Alongside the per-process signals, Anomalous takes a machine-wide context snapshot each tick — memory pressure, swap, thermal state, load averages, and active core count — so it can read the same spike differently on a box under memory pressure than on an idle one.
Where the hardware sensors are readable, it also records SoC die temperature (the hottest die sensor, in °C) and per-rail power (average watts drawn by the CPU, GPU, and ANE rails). These are optional. When a sensor surface is missing on a given Mac, that dimension goes nil — honest absence, never a fake zero. On the tested unprivileged build only the GPU power rail accumulates, so the CPU and ANE rails stay unknown.
Under the hood
System context uses cheap sysctl/libc calls, each degrading independently to a 0 default (SystemSignals.swift:118-132). Die temperature is read unprivileged from the IOHID sensor grid (AppleVendor usage page 0xff00, ~38°C on test hardware); per-rail power is Δenergy/Δwall from IOReport's "Energy Model" group (Sensors.swift:37-58,144-184). These private surfaces are resolved defensively so a rename silences a dimension rather than crashing.
The cost: a short burst, then nothing
All of this is a short burst, not a continuous poll. The sampling itself is a single proc_pid_rusage call per process — a few milliseconds. Once the per-process baseline math and detection run on top, a full check measures around 0.4% CPU on a busy Mac (the app plus the root helper), and 0% between checks. There is no continuous polling, no fan spin-up, and no measurable drain on your battery — and the cadence eases off on battery and under thermal or Low Power pressure.
Nor is anything sensitive captured. Every measurement is a numeric counter — no file contents, no network payloads. The executable path is read only locally to derive a program's identity and install-source category, then discarded. Network measurement records byte counts only, never the endpoint. This is what lets Anomalous watch everything, all the time, and stay silent. For more on that boundary, see what Anomalous keeps.
The full signal list
| Signal | Unit | Why it reveals bad behavior |
|---|---|---|
| CPU time | processor seconds | Sustained high CPU is a wedged loop or runaway task |
| Physical footprint | bytes | Monotonic growth above a floor is a memory leak |
| RSS | bytes | Kept for continuity; ~3x overstated, so deprioritized |
| Disk I/O | bytes read / written | Sustained throughput above baseline is disk thrash |
| Energy | nanojoules | The direct battery-drain measure |
| P/E core split | nanojoules on P-cores | Reveals work landing on the expensive high-power cores |
| Wakeups | idle + interrupt count | Busy-polling drains battery even at low CPU |
| Instructions + cycles | count (IPC ratio) | Productive work vs idle spinning |
| GPU time | mach-absolute ticks | Sustained ~40%+ of the device is a real GPU workload |
| Neural Engine memory | bytes | Which program is holding on-device AI models |
| Network bytes | bytes in / out | Sustained throughput above baseline catches exfiltration |
| Per-process uptime | seconds | Denominator for the CPU ratio and warm-up gate |
| SoC die temperature | °C | Silicon temperature as system context |
| Per-rail power | watts | Ground-truth power draw per subsystem |